xychart

11 samples from the mermaid demo corpus, rendered both ways.

Example 1

match
0.00% width difference
SebastianJSno browser
SebastianJS rendering
mermaid-cliheadless Chrome
mermaid-cli rendering
Mermaid source
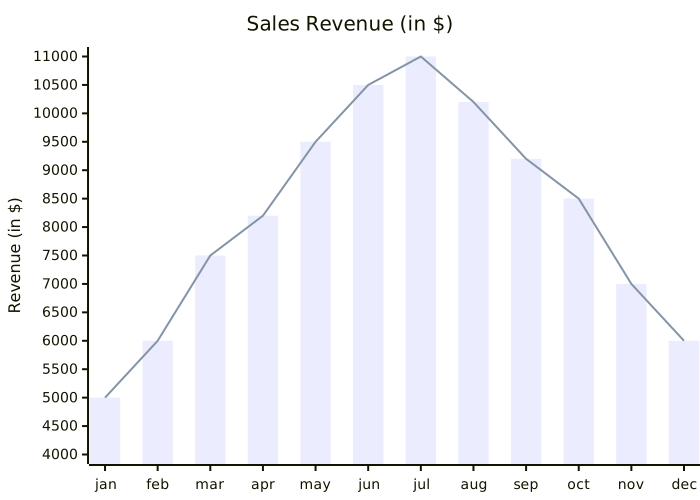
xychart-beta
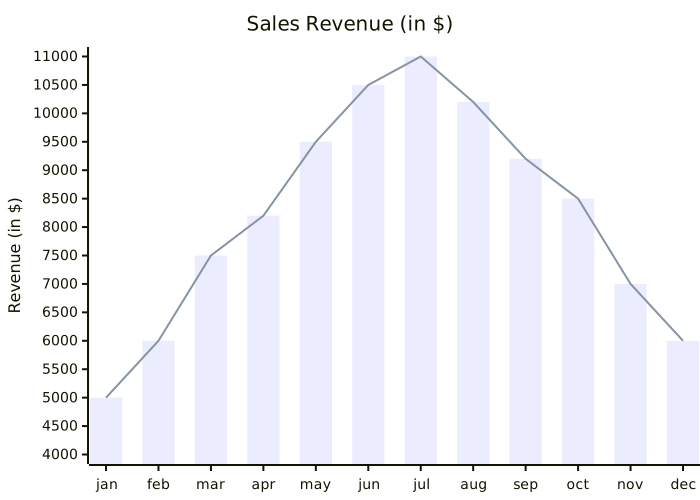
title "Sales Revenue (in $)"
x-axis [jan, feb, mar, apr, may, jun, jul, aug, sep, oct, nov, dec]
y-axis "Revenue (in $)" 4000 --> 11000
bar [5000, 6000, 7500, 8200, 9500, 10500, 11000, 10200, 9200, 8500, 7000, 6000]
line [5000, 6000, 7500, 8200, 9500, 10500, 11000, 10200, 9200, 8500, 7000, 6000]
Example 2

match
0.00% width difference
SebastianJSno browser
SebastianJS rendering
mermaid-cliheadless Chrome
mermaid-cli rendering
Mermaid source
xychart-beta horizontal
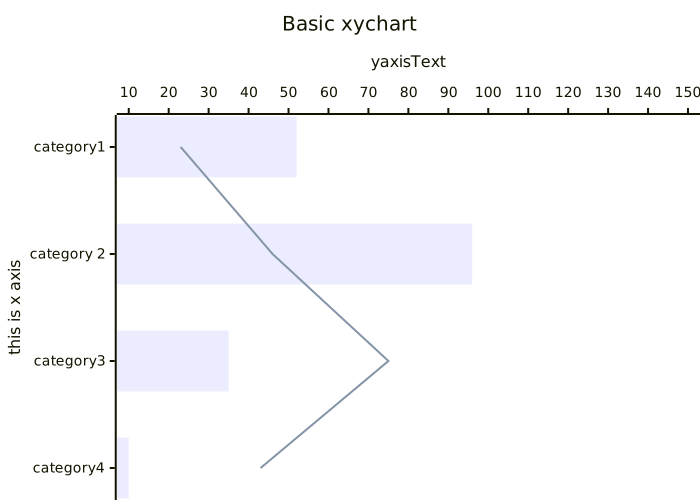
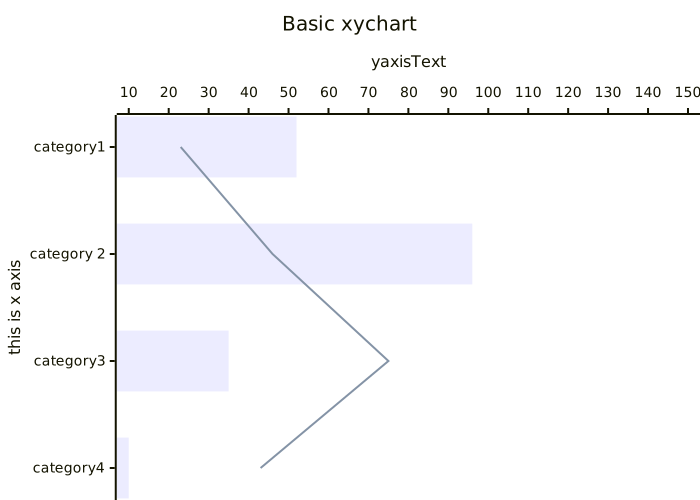
title "Basic xychart"
x-axis "this is x axis" [category1, "category 2", category3, category4]
y-axis yaxisText 10 --> 150
bar "sample bat" [52, 96, 35, 10]
line [23, 46, 75, 43]

Example 3

match
0.00% width difference
SebastianJSno browser
SebastianJS rendering
mermaid-cliheadless Chrome
mermaid-cli rendering
Mermaid source
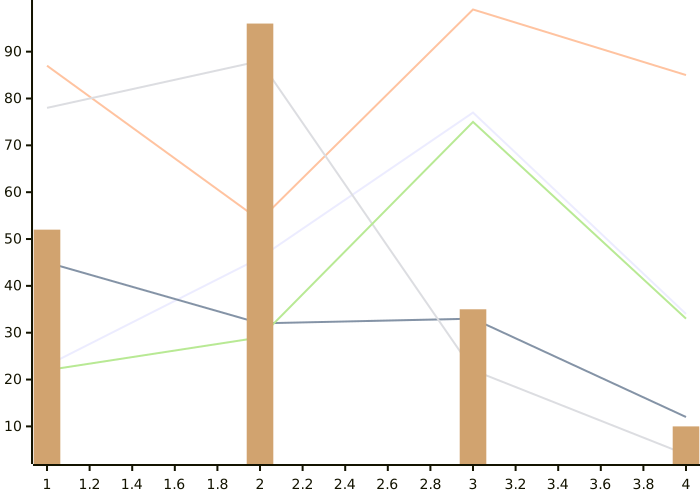
xychart-beta
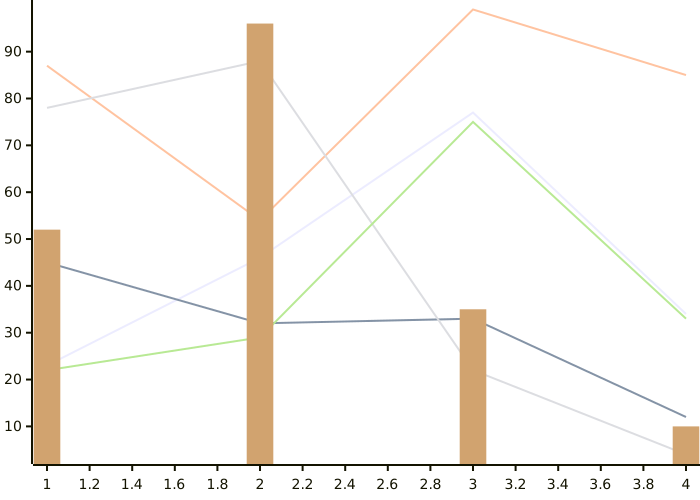
line [23, 46, 77, 34]
line [45, 32, 33, 12]
line [87, 54, 99, 85]
line [78, 88, 22, 4]
line [22, 29, 75, 33]
bar [52, 96, 35, 10]

Example 4

match
0.00% width difference
SebastianJSno browser
SebastianJS rendering
mermaid-cliheadless Chrome
mermaid-cli rendering
Mermaid source
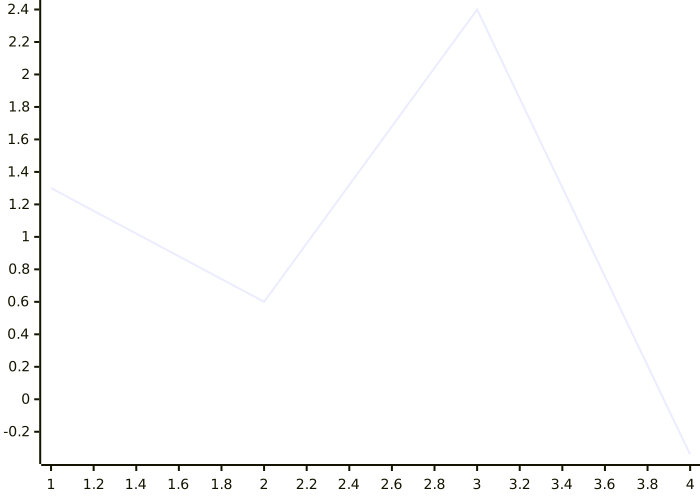
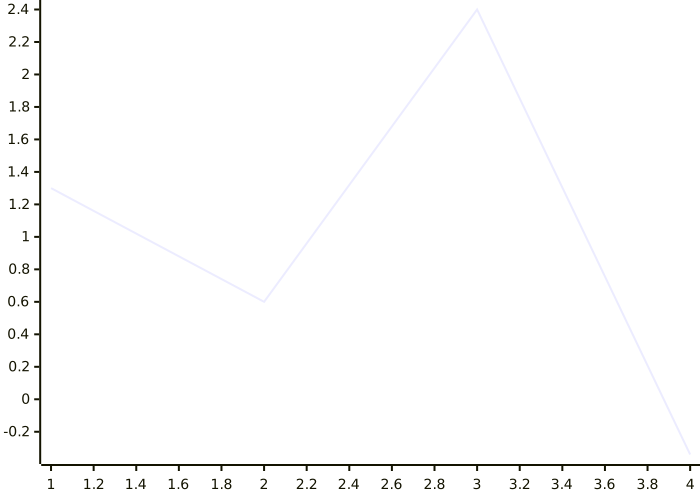
xychart-beta
line [+1.3, .6, 2.4, -.34]

Example 5

match
0.00% width difference
SebastianJSno browser
SebastianJS rendering
mermaid-cliheadless Chrome
mermaid-cli rendering
Mermaid source
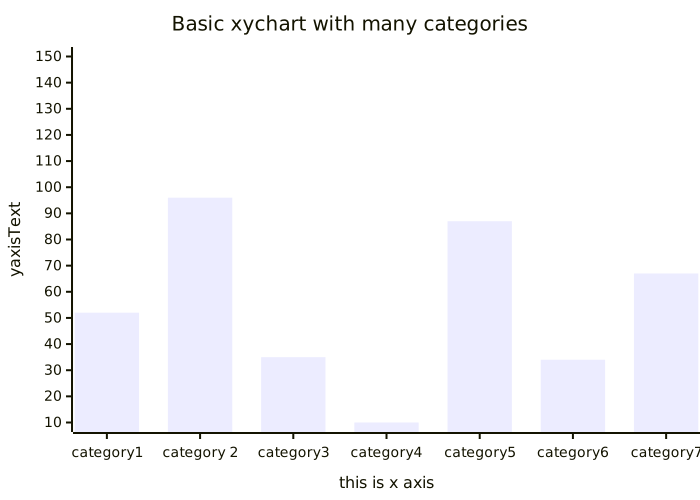
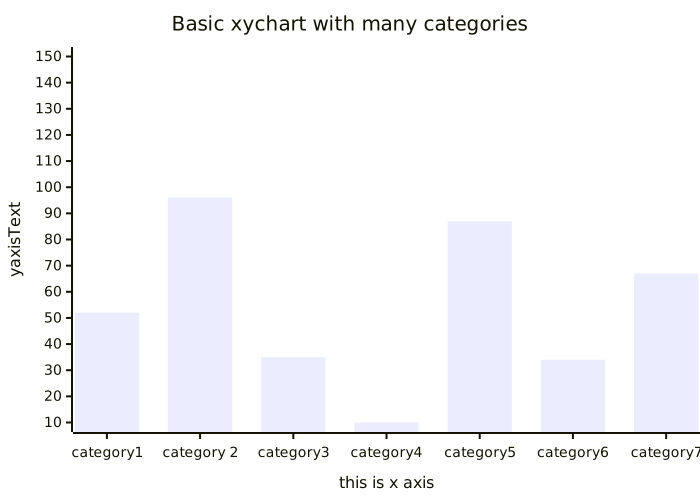
xychart-beta
title "Basic xychart with many categories"
x-axis "this is x axis" [category1, "category 2", category3, category4, category5, category6, category7]
y-axis yaxisText 10 --> 150
bar "sample bar" [52, 96, 35, 10, 87, 34, 67, 99]

Example 6

match
0.00% width difference
SebastianJSno browser
SebastianJS rendering
mermaid-cliheadless Chrome
mermaid-cli rendering
Mermaid source
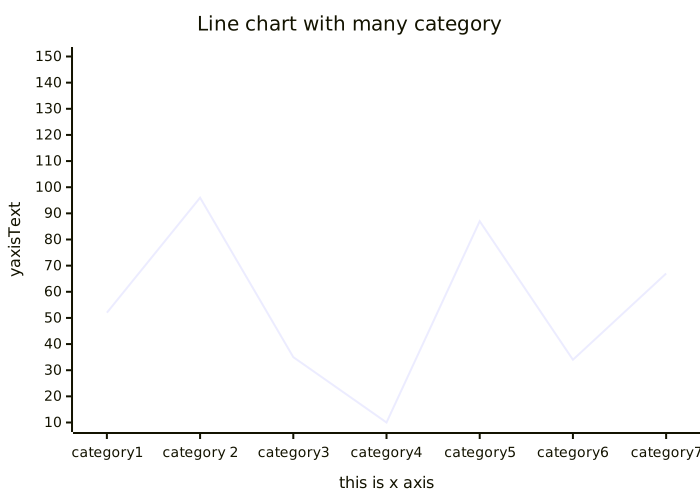
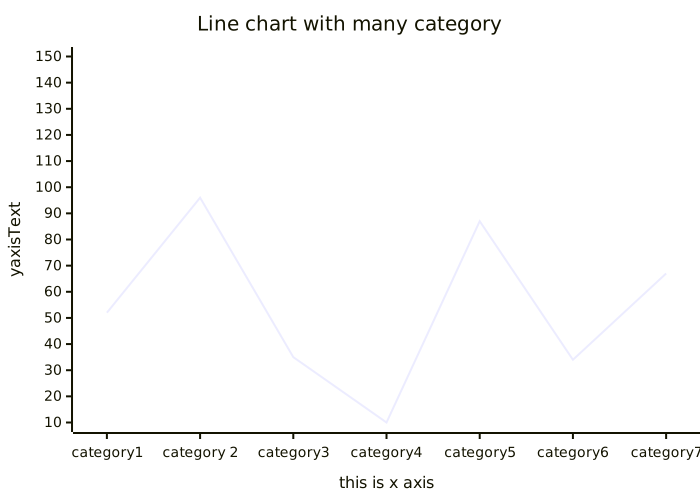
xychart-beta
title "Line chart with many category"
x-axis "this is x axis" [category1, "category 2", category3, category4, category5, category6, category7]
y-axis yaxisText 10 --> 150
line "sample line" [52, 96, 35, 10, 87, 34, 67, 99]

Example 7

match
0.00% width difference
SebastianJSno browser
SebastianJS rendering
mermaid-cliheadless Chrome
mermaid-cli rendering
Mermaid source
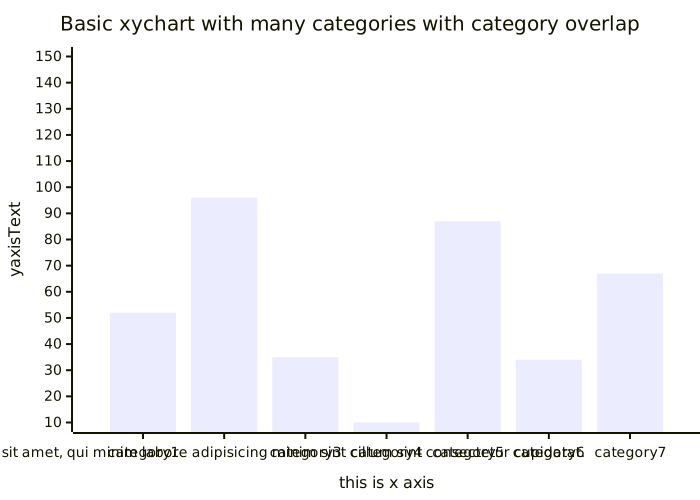
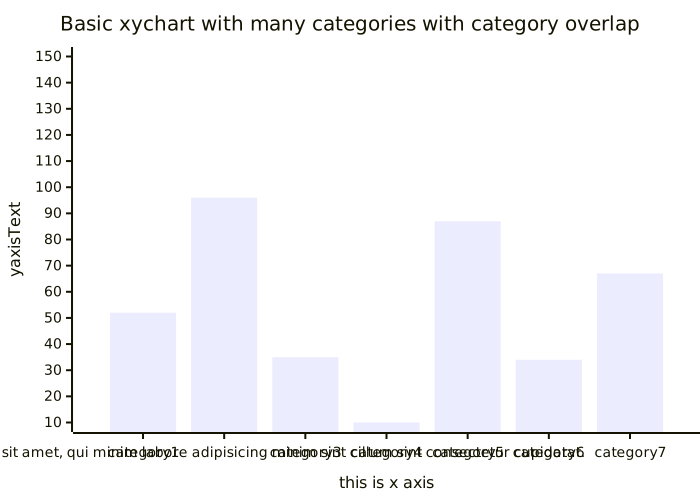
xychart-beta
title "Basic xychart with many categories with category overlap"
x-axis "this is x axis" [category1, "Lorem ipsum dolor sit amet, qui minim labore adipisicing minim sint cillum sint consectetur cupidatat.", category3, category4, category5, category6, category7]
y-axis yaxisText 10 --> 150
bar "sample bar" [52, 96, 35, 10, 87, 34, 67, 99]

Example 8

match
0.00% width difference
SebastianJSno browser
SebastianJS rendering
mermaid-cliheadless Chrome
mermaid-cli rendering
Mermaid source
---
config:
  theme: dark
  xyChart:
    width: 200
    height: 20
    plotReservedSpacePercent: 100
---
    xychart-beta
      line [5000, 9000, 7500, 6200, 9500, 5500, 11000, 8200, 9200, 9500, 7000, 8800]

Example 9

match
0.00% width difference
SebastianJSno browser
SebastianJS rendering
mermaid-cliheadless Chrome
mermaid-cli rendering
Mermaid source
---
config:
  theme: dark
  xyChart:
    width: 200
    height: 20
    plotReservedSpacePercent: 100
---
    xychart-beta
      bar [5000, 9000, 7500, 6200, 9500, 5500, 11000, 8200, 9200, 9500, 7000, 8800]

Example 10

match
0.00% width difference
SebastianJSno browser
SebastianJS rendering
mermaid-cliheadless Chrome
mermaid-cli rendering
Mermaid source
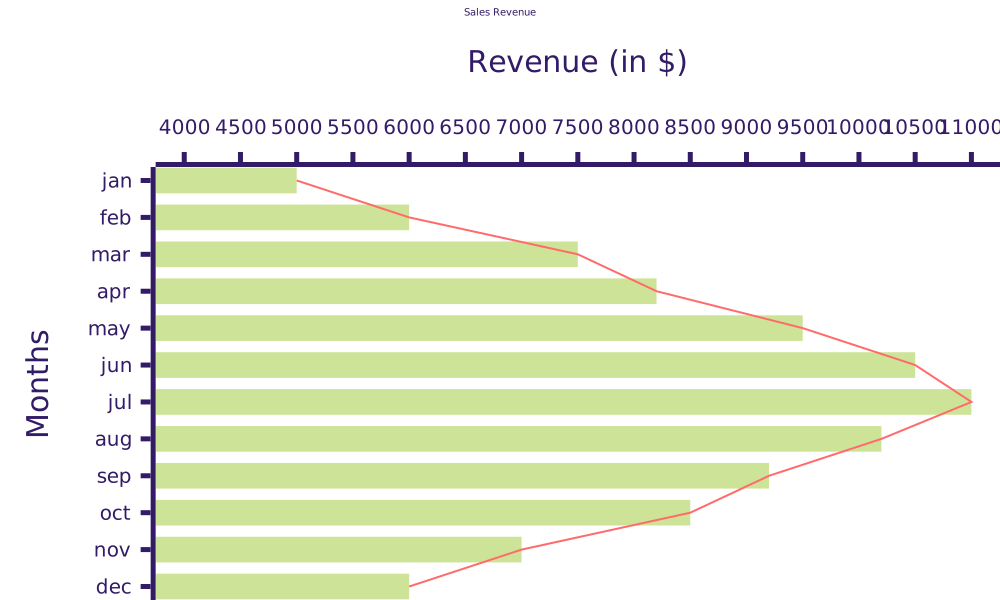
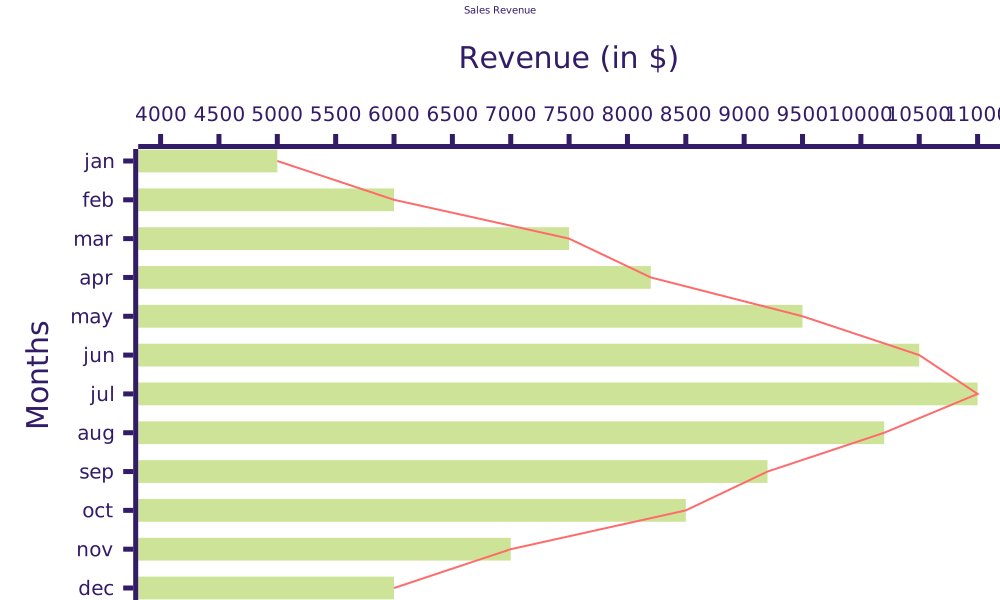
---
config:
  theme: forest
  xyChart:
    width: 1000
    height: 600
    titlePadding: 5
    titleFontSize: 10
    xAxis:
      labelFontSize: 20
      labelPadding: 10
      titleFontSize: 30
      titlePadding: 20
      tickLength: 10
      tickWidth: 5
      axisLineWidth: 5
    yAxis:
      labelFontSize: 20
      labelPadding: 10
      titleFontSize: 30
      titlePadding: 20
      tickLength: 10
      tickWidth: 5
      axisLineWidth: 5
    chartOrientation: horizontal
    plotReservedSpacePercent: 60
---
    xychart-beta
      title "Sales Revenue"
      x-axis Months [jan, feb, mar, apr, may, jun, jul, aug, sep, oct, nov, dec]
      y-axis "Revenue (in $)" 4000 --> 11000
      bar [5000, 6000, 7500, 8200, 9500, 10500, 11000, 10200, 9200, 8500, 7000, 6000]
      line [5000, 6000, 7500, 8200, 9500, 10500, 11000, 10200, 9200, 8500, 7000, 6000]
Example 11

match
0.00% width difference
SebastianJSno browser
SebastianJS rendering
mermaid-cliheadless Chrome
mermaid-cli rendering
Mermaid source
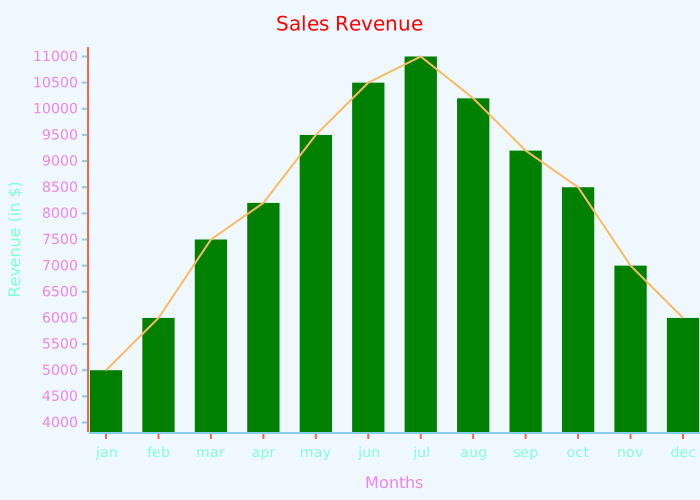
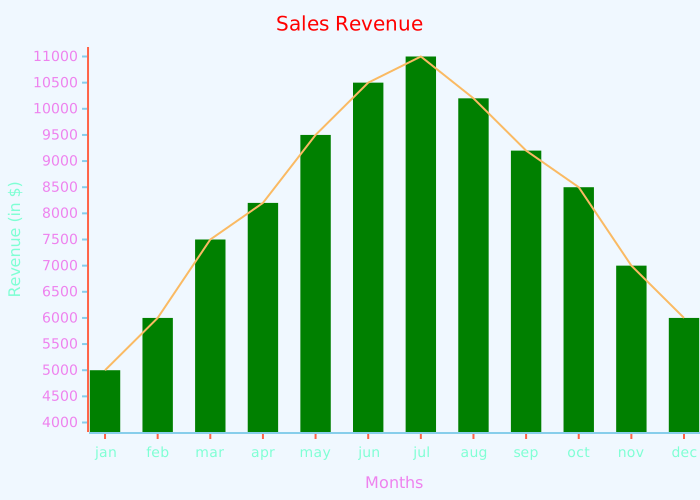
---
config:
  themeVariables:
    xyChart:
      titleColor: "#ff0000"
      backgroundColor: "#f0f8ff"
      yAxisLabelColor: "#ee82ee"
      yAxisTitleColor: "#7fffd4"
      yAxisTickColor: "#87ceeb"
      yAxisLineColor: "#ff6347"
      xAxisLabelColor: "#7fffd4"
      xAxisTitleColor: "#ee82ee"
      xAxisTickColor: "#ff6347"
      xAxisLineColor: "#87ceeb"
      plotColorPalette: "#008000, #faba63"
---
    xychart-beta
      title "Sales Revenue"
      x-axis Months [jan, feb, mar, apr, may, jun, jul, aug, sep, oct, nov, dec]
      y-axis "Revenue (in $)" 4000 --> 11000
      bar [5000, 6000, 7500, 8200, 9500, 10500, 11000, 10200, 9200, 8500, 7000, 6000]
      line [5000, 6000, 7500, 8200, 9500, 10500, 11000, 10200, 9200, 8500, 7000, 6000]